Pure Tone Audiogram: Symbols | Configuration | Interpretation: A person’s hearing capacity is depicted graphically on an audiogram. The most common time it occurs is during an audiometric test, which is carried out by an audiologist or hearing specialist. The audiogram is made up of a grid where the horizontal axis represents frequency (measured in Hertz, Hz) and the vertical axis represents intensity or loudness (measured in decibels, dB).
Pure Tone Audiogram
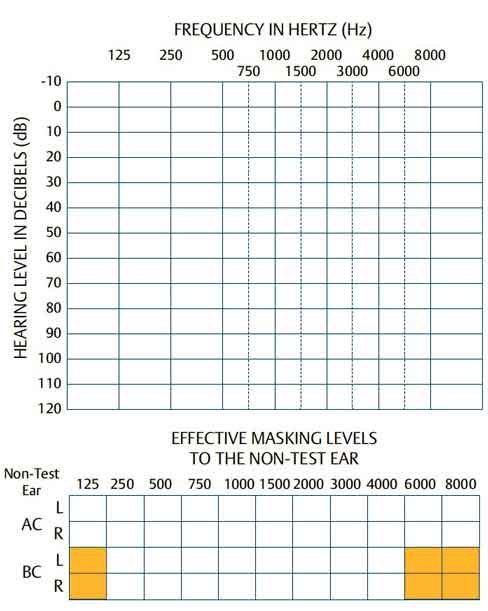
On an audiogram, which is typically represented as a graph, the patient’s thresholds at each frequency are noted. While some audiologists use a different graph for each ear, many audiologists use the same audiogram form to record the data for both ears. The figure displays the suggested audiogram format and symbols from ASHA (1990). Frequency is displayed on the abscissa, ranging from 125 Hz on the left to 8000 Hz on the right, and the frequency axis is typically labeled at the top. Octaves are evenly separated, as you can see. To put it another way, any frequency doubling (for example, 125 to 250 Hz, 1000 to 2000 Hz, 1500 to 3000 Hz, and 4000 to 8000 Hz) always results in the same distance traveled. As a result, an audiogram’s frequency scale is logarithmic. The y-axis displays the hearing level in decibels HL (ANSI/ISO or ANSI S3.6-2010), with the highest level (120 dB HL in the figure) at the bottom and a range of -10 to 120 dB HL along the top and bottom, respectively.
Dimensions of Audiogram
The relative dimensions of an audiogram form are crucial, regardless of the size that is most practical. One octave’s travel distance must match that of 20 dB, to be more precise. The squares are 1 octave broad by 20 dB high, so we could say that they are constructed of them. For a patient’s audiogram to always have the same structure and perspective, the relative proportions are crucial. If the relative sizes were not equal, the identical hearing loss could appear to have a high slope on one form and a shallow slope on another.
The quantity of masking noise employed, if any, is noted in the table below the audiogram in Figure. In this case, “AC” stands for air conditioning testing masking, and “BC” stands for bone conduction testing masking. It should be noted that this table refers to the “non-test ear” rather than the ear that is being tested. This ear is the one that hears the masking noise.
Audiogram Symbols
Audiogram Symbols for Air Conduction
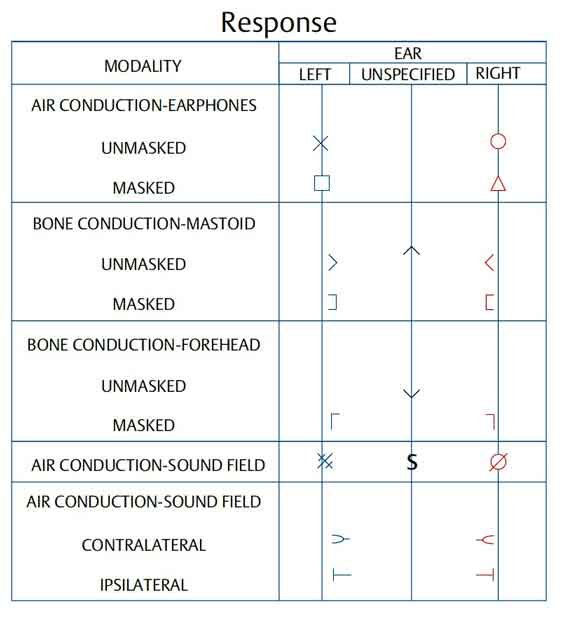
A key describing the Audiogram symbols used to plot information on the audiogram should be included with every audiogram form. The ASHA (1990) approved audiogram symbols are shown in Figure. The fact that many of the symbols correspond to ideas you are not yet familiar with should not frustrate you. In addition to highlighting some crucial ideas and the most often used symbols, it would be superfluous to go into further detail about the symbol definitions provided in the key. The terms “unmasked” and “masked” refer to thresholds that were acquired using the methods already discussed in this chapter, respectively. For air conduction, the unmasked symbols are a circle for the right ear and an X for the left ear, while the masked symbols are, respectively, a triangle and a square.
Audiogram Symbols for Bone Conduction
The bone vibrator can be found on the right or left mastoid or on the forehead, according to the bone-conduction symbols, which indicate where it is situated. The comparable left symbols are a > and ] and the right unmasked and masked mastoid bone-conduction symbols are < and [, respectively. The student will quickly discover that, regardless of where the vibrator is positioned, bone-conduction impulses are caught up by the improved cochlea. Because of this, the unmasked “right” and “left” mastoid bone-conduction symbols (< and >) really relate to the position of the vibrator rather than the ear that received the signal.
Audiogram Symbols for Sound Field: The sound field threshold is denoted by an S and is listed on the key as “unspecified” because any or both of the two ears could have picked up the signal.
Audiogram Symbols for No Response
An arrow pointing downward is added to the symbol if a signal receives no response at the audiometer’s maximum level. On the audiogram, no-response symbols should be placed at the highest testable level. The no-response symbol, for instance, would be placed at 70 dB HL if there is no response to a bone-conduction tone at the maximum testing level of 70 dB HL.
Historically, right symbols have been plotted in red, and left symbols have been plotted in blue or black to make it simpler to distinguish between left and right ear signals on the same audiogram. The red/blue distinction, however, is likely overemphasized because it is lost whenever information needs to be shared: standard photocopies, faxes, carbon paper, and NCR paper only produce single-color copies; printed material is only available in black and white; and some blues and reds do not photocopy well. Because of this, using red and blue is no longer strictly necessary, despite being very practical and desirable.

Tabular arrangements of audiometric records
Tabular arrangements of audiometric records are valuable when comparing audiograms over time, in which case the serial audiograms are recorded on separate lines of a table, one under the other. They also lend themselves to computerized record keeping. “No responses” should be indicated on numerical audiograms along with the maximum testable level.
For example, a no response to a maximum bone-conduction signal of 80 dB HL could be written as “NR70,” “70NR,” “70+,” or “70↓.” However, just writing “NR” is ambiguous because one does not know what the highest level was, and the practice of writing the next-higher level (85 in this case) is very misleading.
Types of Audiogram Configuration
These are some of the common types of audiograms used by audiologists and healthcare professionals to assess different aspects of hearing function and identify various types of hearing disorders. The choice of audiogram depends on the specific diagnostic needs of the patient.
Audiometric Configurations
The Audiometric Configurations adapted from Carhart (1945) and Kaplan (1978) with respect to the positive or negative slope of the air conduction thresholds are classified as:
- Flat Audiogram
- Slopping Audiogram
- Gradually Slopping Audiogram
- Sharply Sloping Audiogram
- Precipitously Slopping Audiogram
- Rising Audiogram
- Trough Audiogram
- Notch Audiogram
- Carhart (2Khz) Notch
- Boilers (4Khz) Notch
- Saucer Audiogram
- Cookie Bite Audiogram
Flat Audiogram
< 5 dB Rise or Fall per octave
The Flat Audiogram is characterized by consistent hearing sensitivity across the frequency range. In simpler terms, it indicates that a person’s hearing is equally good across all pitches or frequencies. While this may sound like ideal hearing, it can also signify a hearing impairment, especially if it falls within the lower range of sensitivity.
- Hearing thresholds are relatively consistent across the frequency range.
- There are no significant peaks or dips in hearing sensitivity at specific frequencies.
- Hearing sensitivity remains relatively stable from low to high frequencies.

Sloping Audiogram
5 or more than 5 dB Threshold increase per octave
A Sloping Audiogram is a bit more complex. It implies that there is a noticeable difference in hearing sensitivity between high and low frequencies. Typically, it shows better hearing for low-pitched sounds and reduced sensitivity to high-pitched sounds or vice versa.
Gradually Sloping Audiogram
5 – 12 dB Threshold increase per octave
This audiogram pattern exhibits a gentle and gradual decline in hearing sensitivity as we move from low to high frequencies. Gradually Sloping Audiograms are often indicative of age-related hearing loss, also known as presbycusis.
- Hearing thresholds show a gradual increase in hearing sensitivity from low to high frequencies.
- The degree of hearing loss becomes progressively worse as the frequency increases.
- This pattern can be associated with various factors, including age-related hearing loss (presbycusis) or exposure to high-frequency noise.
Sharply Sloping Audiogram
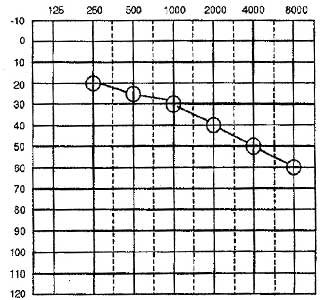
15 – 20 dB Threshold increase per octave
In contrast to the gradual slope, a Sharply Sloping Audiogram depicts a sudden and significant drop in hearing sensitivity at a particular frequency. This type of audiogram may be seen in cases of sudden sensorineural hearing loss or noise-induced hearing damage.
- Hearing thresholds show a rapid and significant decrease in hearing sensitivity as the frequency increases.
- The degree of hearing loss becomes notably worse at higher frequencies.
- This pattern is indicative of sensorineural hearing loss, which is characterized by damage to the hair cells in the inner ear or issues with the auditory nerve pathways.
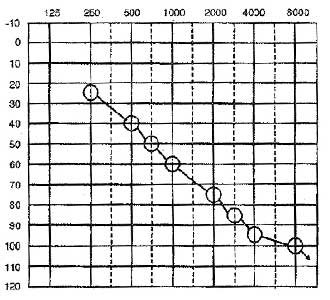
Precipitously Sloping Audiogram
Flat or gradually sloping, then threshold increasing at rate of 25+ dB per octave
Similar to the Sharply Sloping Audiogram, the Precipitously Sloping Audiogram shows a steep decline in hearing sensitivity but can occur over a broader frequency range. It’s crucial to identify the underlying cause, which could range from genetics to exposure to loud noise.
- Hearing thresholds show a sharp and rapid decline in hearing sensitivity as the frequency increases.
- The degree of hearing loss becomes extremely pronounced at higher frequencies.
- This pattern is indicative of severe sensorineural hearing loss, where there is significant damage to the hair cells in the inner ear or problems with the auditory nerve pathways.
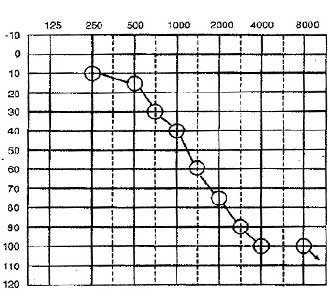
Rising Audiogram
5 dB or More threshold decrease per octave
The Rising Audiogram is a rare pattern where hearing sensitivity is better for high-pitched sounds and poorer for low-pitched sounds. This can be due to various factors, including certain medical conditions or congenital factors.
- Hearing thresholds show an improvement or increase in hearing sensitivity as the frequency increases.
- The degree of hearing loss becomes less pronounced at higher frequencies.
- This pattern can be indicative of conductive hearing loss, a type of hearing impairment that is often associated with problems in the outer or middle ear, such as earwax blockage, fluid buildup, or issues with the ear’s mechanical components, like the eardrum or the tiny bones (ossicles) in the middle ear.
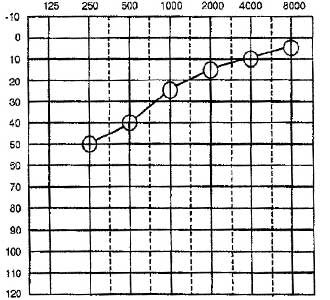
Trough Audiogram
20 dB or Greater loss at the mid-frequencies
A Trough Audiogram displays a significant dip in hearing sensitivity, often in the middle frequencies. This pattern can indicate various conditions and further evaluation is necessary to pinpoint the exact cause.
In cases of sudden-onset sensorineural hearing loss, the audiogram had a trough shape, with the mid-frequency range suffering the most from the hearing loss. Patients with acoustic neuromas experienced a trough-shaped audiogram substantially more often than those without one.
In a report, we might use terms like “trough-shaped,” “U-shaped,” or “inverted U-shaped” to describe a cookie bite audiogram. When we are discussing a case with colleagues, it is different because even though we are all familiar with terminology like “cookie bite” and “ski slope,” we wouldn’t use them in a formal report.
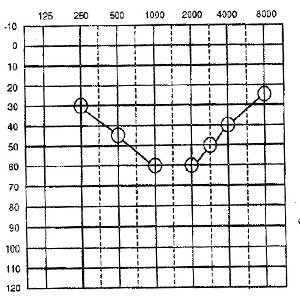
Notch Audiogram
A loss of 20 dB or more at one frequency with complete or near-complete recovery at adjacent octave frequencies
A Notch Audiogram is characterized by a distinct “notch” or drop in hearing sensitivity at a specific frequency range. One well-known example is the Carhart (2Khz) Notch, which can be associated with noise exposure.
- A drop in hearing sensitivity at one or more frequencies, often depicted as a “notch” shape on the graph.
- Hearing thresholds are typically normal at lower and higher frequencies.
- The notch is most commonly seen in the 3 kHz to 6 kHz frequency range, but it can occur at other frequencies as well.
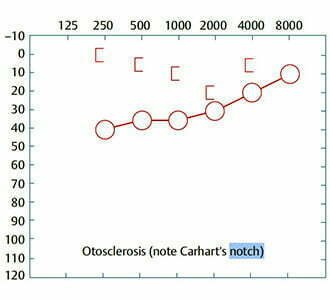
Carhart (2Khz) Notch
A sharp dip at a 2Khz frequency with recovery at the immediately adjacent frequencies
At 2000 Hz, there is a common increase in the bone-conduction threshold known as Carhart’s notch (Carhart 1950). This does not, however, represent a true sensorineural aspect of the illness. The ankylosis, which stops the ossicles from vibrating regularly, is assumed to be the source of Carhart’s notch instead of the mechanical advantage offered by the 2000 Hz resonance of the ossicular chain.
- A significant drop in hearing sensitivity at the 2 kHz frequency.
- Generally, hearing thresholds are relatively better at both lower and higher frequencies.
- The presence of a Carhart notch at 2 kHz is a key indicator for otosclerosis, but a definitive diagnosis typically requires further evaluation, such as a physical examination by an ear, nose, and throat specialist (otolaryngologist), imaging studies, and other diagnostic tests.
Boilers (4Khz) Notch
A sharp dip at a 4Khz frequency with recovery at the immediately adjacent frequencies
The Boilers (4Khz) Notch is another specific type of Notch Audiogram, often linked to occupational exposure to loud machinery. Identifying this notch can be crucial for early intervention and prevention.
- There is typically a noticeable drop in hearing sensitivity at higher frequencies, which can include 4 kHz (4,000 Hz).
- Lower frequencies may have relatively better hearing thresholds.
- This pattern of hearing loss is consistent with the expected effects of noise-induced hearing damage, where higher frequencies are often affected more severely due to the damaging impact of loud sounds.

Saucer Audiogram
20 dB or Greater loss at the extreme frequencies than at the mid-frequencies
The Saucer Audiogram resembles the shape of a saucer, with better hearing sensitivity in the middle frequencies and reduced sensitivity at the extremes. It can be associated with certain medical conditions and warrants further investigation.
- Better hearing sensitivity is observed in the middle frequencies (typically between 1 kHz and 2 kHz).
- Hearing sensitivity gradually decreases as you move toward both lower and higher frequencies.
- The overall shape of the graph resembles a saucer, with better hearing in the middle.
Cookie Bite Audiogram
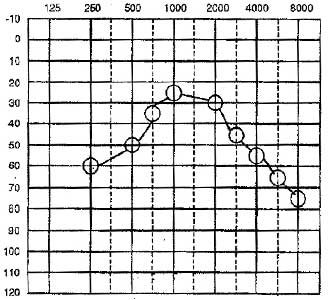
A noticeable reduction in hearing sensitivity in the mid-frequency range, typically between 1 kHz and 2 kHz
Lastly, the Cookie Bite Audiogram is characterized by a drop in sensitivity in the mid-frequency range. This pattern can be hereditary and is often associated with congenital hearing loss.
According to Van Camp and Smith (2013), non-syndromic hearing loss that is inherited as a dominant (DFNA) characteristic that maps to one of the 22 autosomal chromosomes is genetically heterogeneous, having at least 64 loci and more than 25 identified genes. There are several permutations, though, such as hearing loss that starts in the low frequencies (for example, DFNA1 and DFNA6/14/23) or mid frequencies with a “cookie-bite” structure (for example, DFNA10).
The onset of postlingual sensory/neural hearing loss occurs between the second and fourth decade of life, frequently with a first cookie-bite configuration or when the medium and high frequencies are involved.

Pure Tone Audiogram Interpretation
Before we dive into interpretation, let’s establish what a pure tone audiogram is. A pure tone audiogram is a graphical representation of an individual’s hearing abilities across different frequencies. The test is conducted by presenting pure tones at various frequencies and recording the softest level at which they can be heard. The results are plotted on a graph, creating an audiogram.
Normal Audiogram
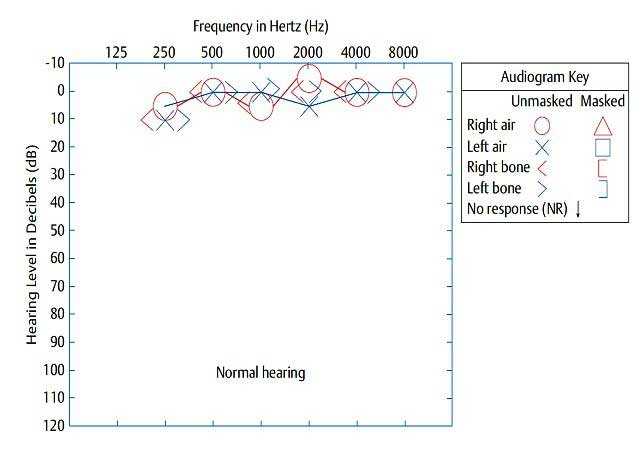
A normal audiogram shows a horizontal line across the graph at 0 – 15 dB HL for all frequencies tested. This indicates that the individual has normal hearing across the entire frequency range.
The figure displays an example of a typical normal audiogram. Nearly 0 dB HL is where all of the air-conduction thresholds for both ears are located. Furthermore, at each frequency, the air- and bone-conduction thresholds are quite close to one another, preventing any discernible air-bone gaps.
In a situation like this, where it is obvious that the hearing is fine, why do we even test for bone conduction? Since 0 dB HL is the typical threshold for normal persons, checking bone conduction is still necessary even when the air-conduction thresholds are normal (Eagles, Wishik, & Doerfler 1967). Thresholds lower than 0 dB HL are therefore predicted to be present in many people, especially in youngsters.

Conductive Hearing Loss Audiogram
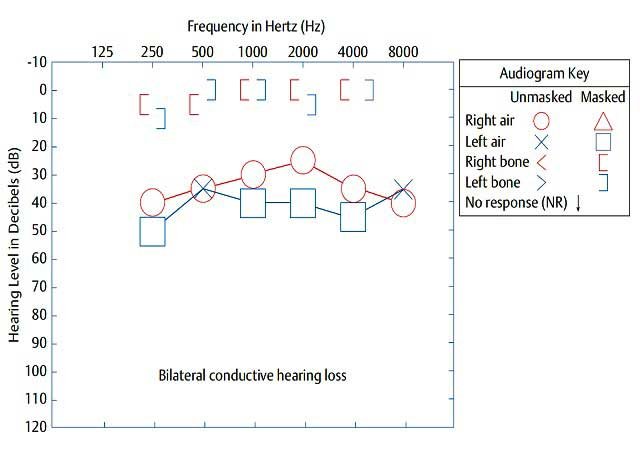
Conductive hearing loss occurs due to problems in the middle or outer ear that prevent sound from reaching the inner ear. Common causes include earwax blockages, ear infections, or issues with the ossicles (tiny bones in the middle ear). When examining an audiogram for conductive hearing loss:
- Shape of the Audiogram: Conductive hearing loss often results in a flat audiogram, indicating that hearing is impaired at all frequencies.
- Configuration: If the air-bone gaps are 15 dB or more, the air conduction thresholds are outside the normal bounds, that is, are 25 dB HL or less, and the bone-conduction thresholds are within the normal limits, then there is conductive hearing loss. Bone conduction thresholds are only regarded as being within normal bounds if they are 15 dB HL or higher. As a result, conductive hearing loss is characterized by good bone-conduction thresholds, which indicate the absence of a problem with the sensorineural mechanism, significant air-bone gaps, which indicate better hearing sensitivity by bone conduction than by air conduction, and poor air-conduction thresholds, which indicate a problem in the outer and/or middle ear (an inner-problem is ruled out by the good bone-conduction thresholds).
Sensorineural Hearing Loss Audiogram
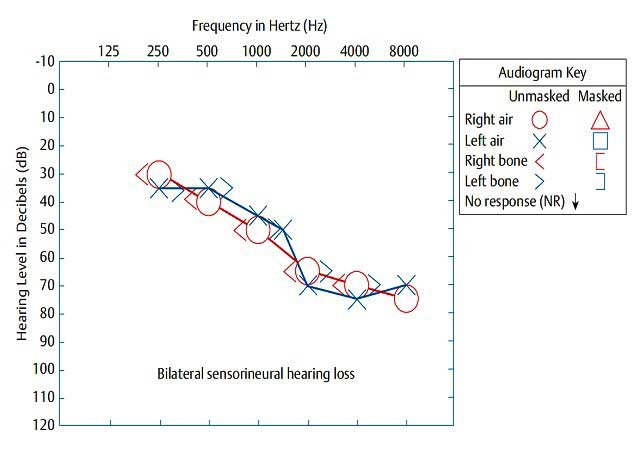
Sensorineural hearing loss happens when there is damage to the inner ear (cochlea) or to the nerve pathways from the inner ear to the brain. It’s typically due to old age, exposure to loud sounds, or other medical issues. When examining an audiogram for sensorineural hearing loss:
- Shape of the Audiogram: Sensorineural hearing loss typically results in a sloping audiogram, where the thresholds are worse at higher frequencies.
- Configuration: If the bone-conduction thresholds are above the normal range, or greater than 15 dB HL, the air-conduction thresholds are above the normal range, or more than 25 dB HL, and there are no significant air-bone gaps (i.e., air-bone gaps do not exceed 10 dB). Therefore, a sensorineural hearing impairment is defined by low bone-conduction thresholds, which indicate a problem with the sensorineural mechanism, and low air-conduction thresholds, which are virtually equivalent.
Mixed Hearing Loss Audiogram
Mixed hearing loss due to the combined effect of sensorineural and conductive hearing loss. When interpreting an audiogram for mixed hearing loss:
- Shape of the Audiogram: The audiogram may display a mixture of sloping and flat configurations, reflecting the coexistence of sensorineural and conductive hearing loss.
- Configuration: A mixed hearing impairment is present if the air-conduction thresholds are above 25 dB HL, the bone-conduction thresholds are above the normal ranges, which is larger than 15 dB HL, and there are significant air-bone gaps that exceed 10 dB HL. Therefore, a mixed loss is characterized by poor bone-conduction thresholds, which indicate a problem in the sensorineural mechanism, significant air-bone gaps exceeding 10 dB, which indicate better hearing sensitivity by bone conduction than by air conduction, and air conduction thresholds worse than the bone conduction thresholds, which indicate a problem in the outer and/or middle ear (conductive mechanism), in addition to the problem in the sensorineural mechanism signaled by the poor bone-conduction thresholds.

Speech Banana Audiogram
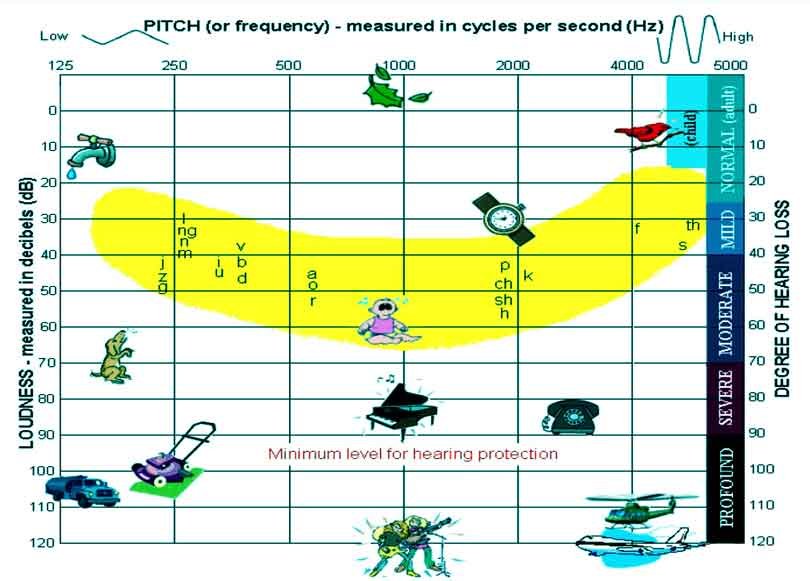
A Speech Banana audiogram is not a fruit-related concept but rather a visual representation of the range of sounds critical for human speech. It is a fundamental tool used by audiologists to assess an individual’s hearing abilities, particularly in the context of speech comprehension.
Significance of Speech Banana Audiogram
On an audiogram, the Speech Banana typically covers frequencies ranging from 250 Hz to 8000 Hz and intensity levels between 20 dB and 40 dB. These frequencies and intensities encompass the majority of speech sounds. Here is a breakdown of some key speech sounds and where they generally fall within the Speech Banana:
- Vowels (a, e, i, o, u): Vowel sounds typically occupy the lower-frequency range, ranging from 250 Hz to 1000 Hz. These sounds are fundamental for word recognition and speech clarity.
- Consonants: Consonant sounds, such as “s,” “sh,” and “f,” tend to occur at higher frequencies, typically above 1000 Hz. They provide crucial details and distinctions in speech, making it easier to differentiate between words.
- Voiceless vs. Voiced Sounds: Recognizing the contrast between voiceless (e.g., “s”) and voiced (e.g., “z”) consonant sounds is vital for speech comprehension. These distinctions often fall within the confines of the Speech Banana.
Conclusion
In conclusion, the pure tone audiogram is a useful tool in the study of audiology, offering crucial perceptions into a person’s hearing capabilities. In addition to determining hearing impairments and their severity, this diagnostic test also directs the creation of individualized treatment programs, such as hearing aids or cochlear implants. Audiologists can make wise choices to enhance a person’s communication and quality of life by charting out their hearing thresholds across a range of frequencies. As a result, the pure tone audiogram continues to be a crucial component in the evaluation and treatment of hearing impairments, enabling people to navigate the world of sound more confidently and clearly.
References:
- Essentials of Audiology – Stanley A. Gelfand, PhD (Book)
- Auditory Diagnosis Principles and Applications – Shlomo Silman & Carol A. Silverman (Book)
- Handbook of Clinical Audiology – Jack Katz (Book)
- Introduction to Audiology – Frederick N.Martin (Book)


0 Comments